Designed for education and research, to visualise and assess climate change risks
SimClim is our stand-alone modelling system that can be customised to examine risks from, and adaptations to, current climate variables and future climate change. Commonly used to build capacity for sustainability officers, policy makers, teachers, students, researchers and both non-governmental and governmental organisations.
Features
Work with AR6, AR5 and observed data
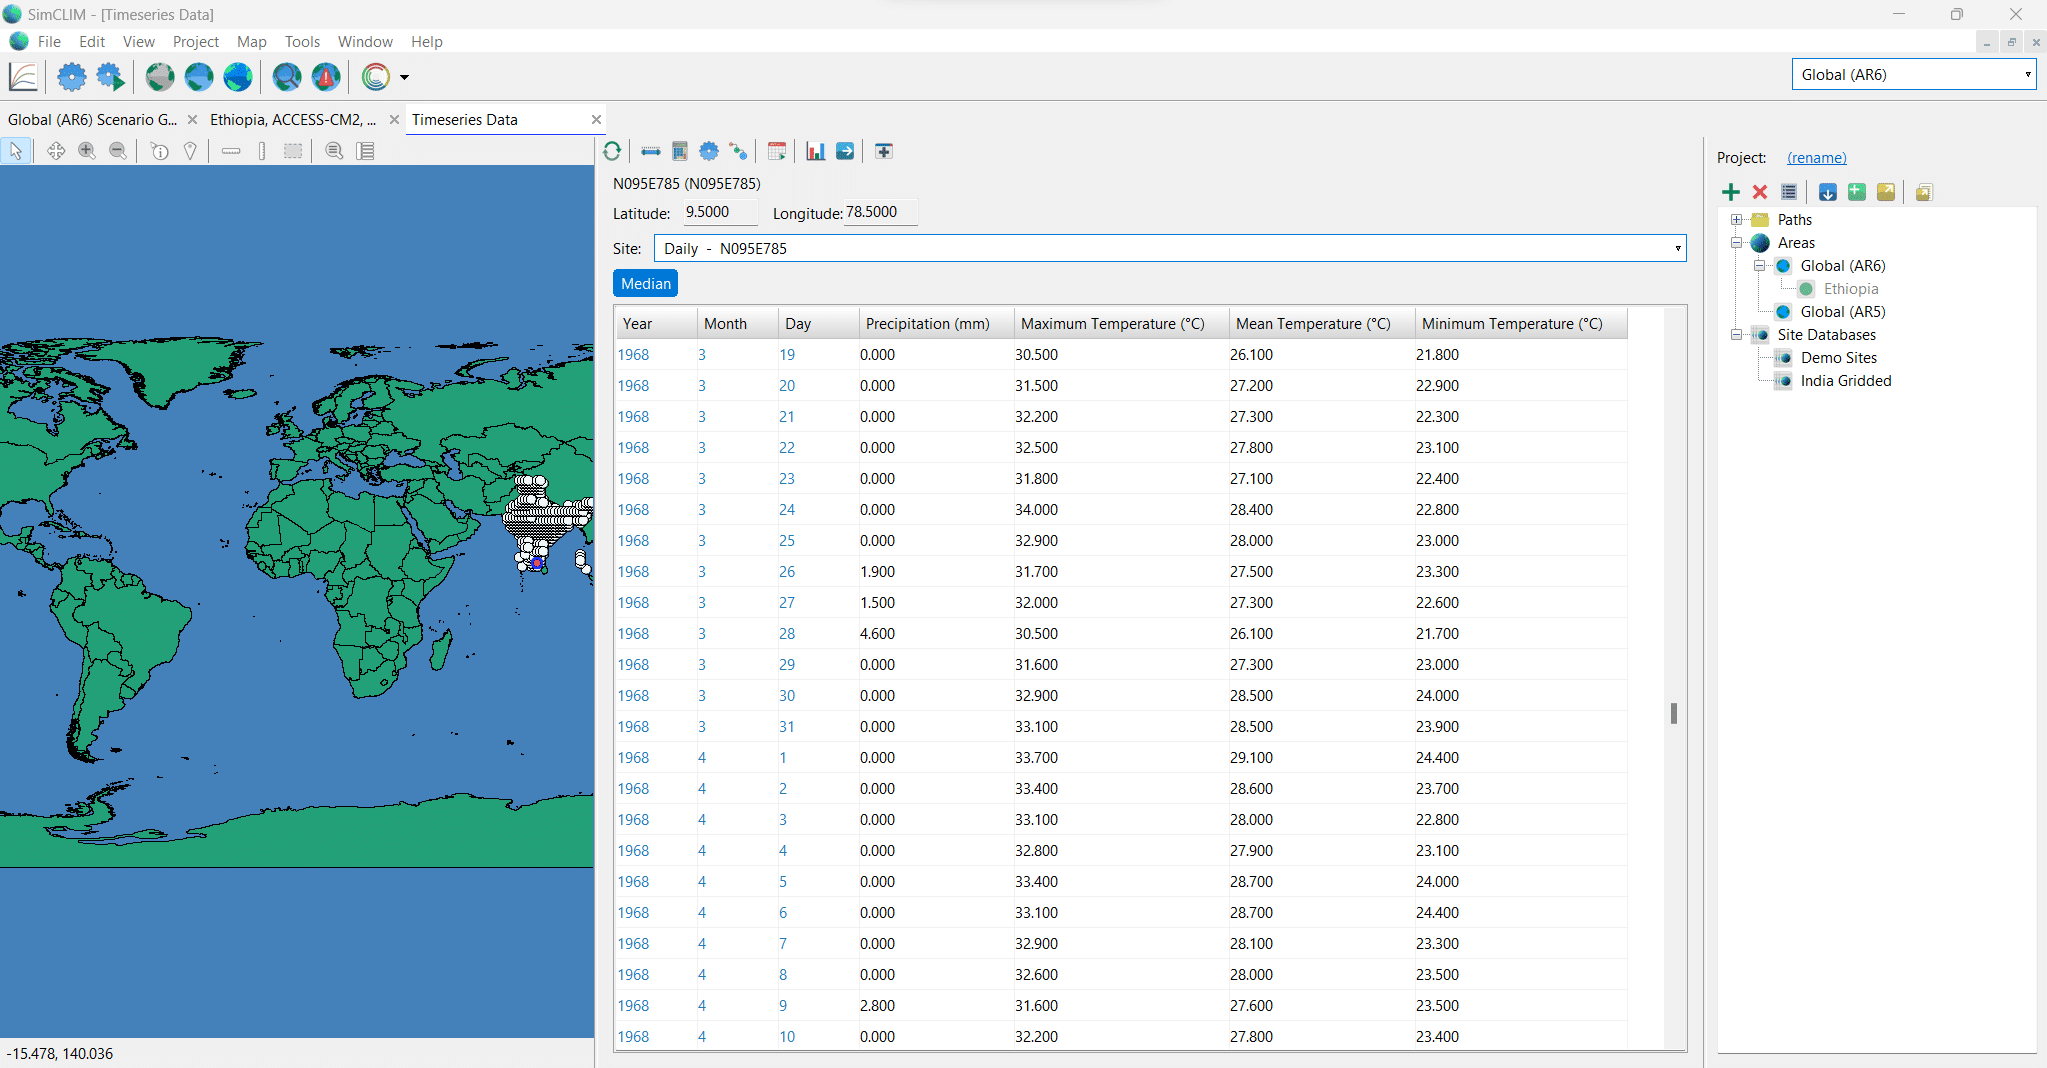
Integrates the latest scientific projections of future climate changes from complex global and regional climate models with observed climate and weather records, impact models and tools for spatial and site analysis.
Manage multiple sets of data
Our new Project Manager allows you to handle multiple sets of country specific and area specific data sets and projects.
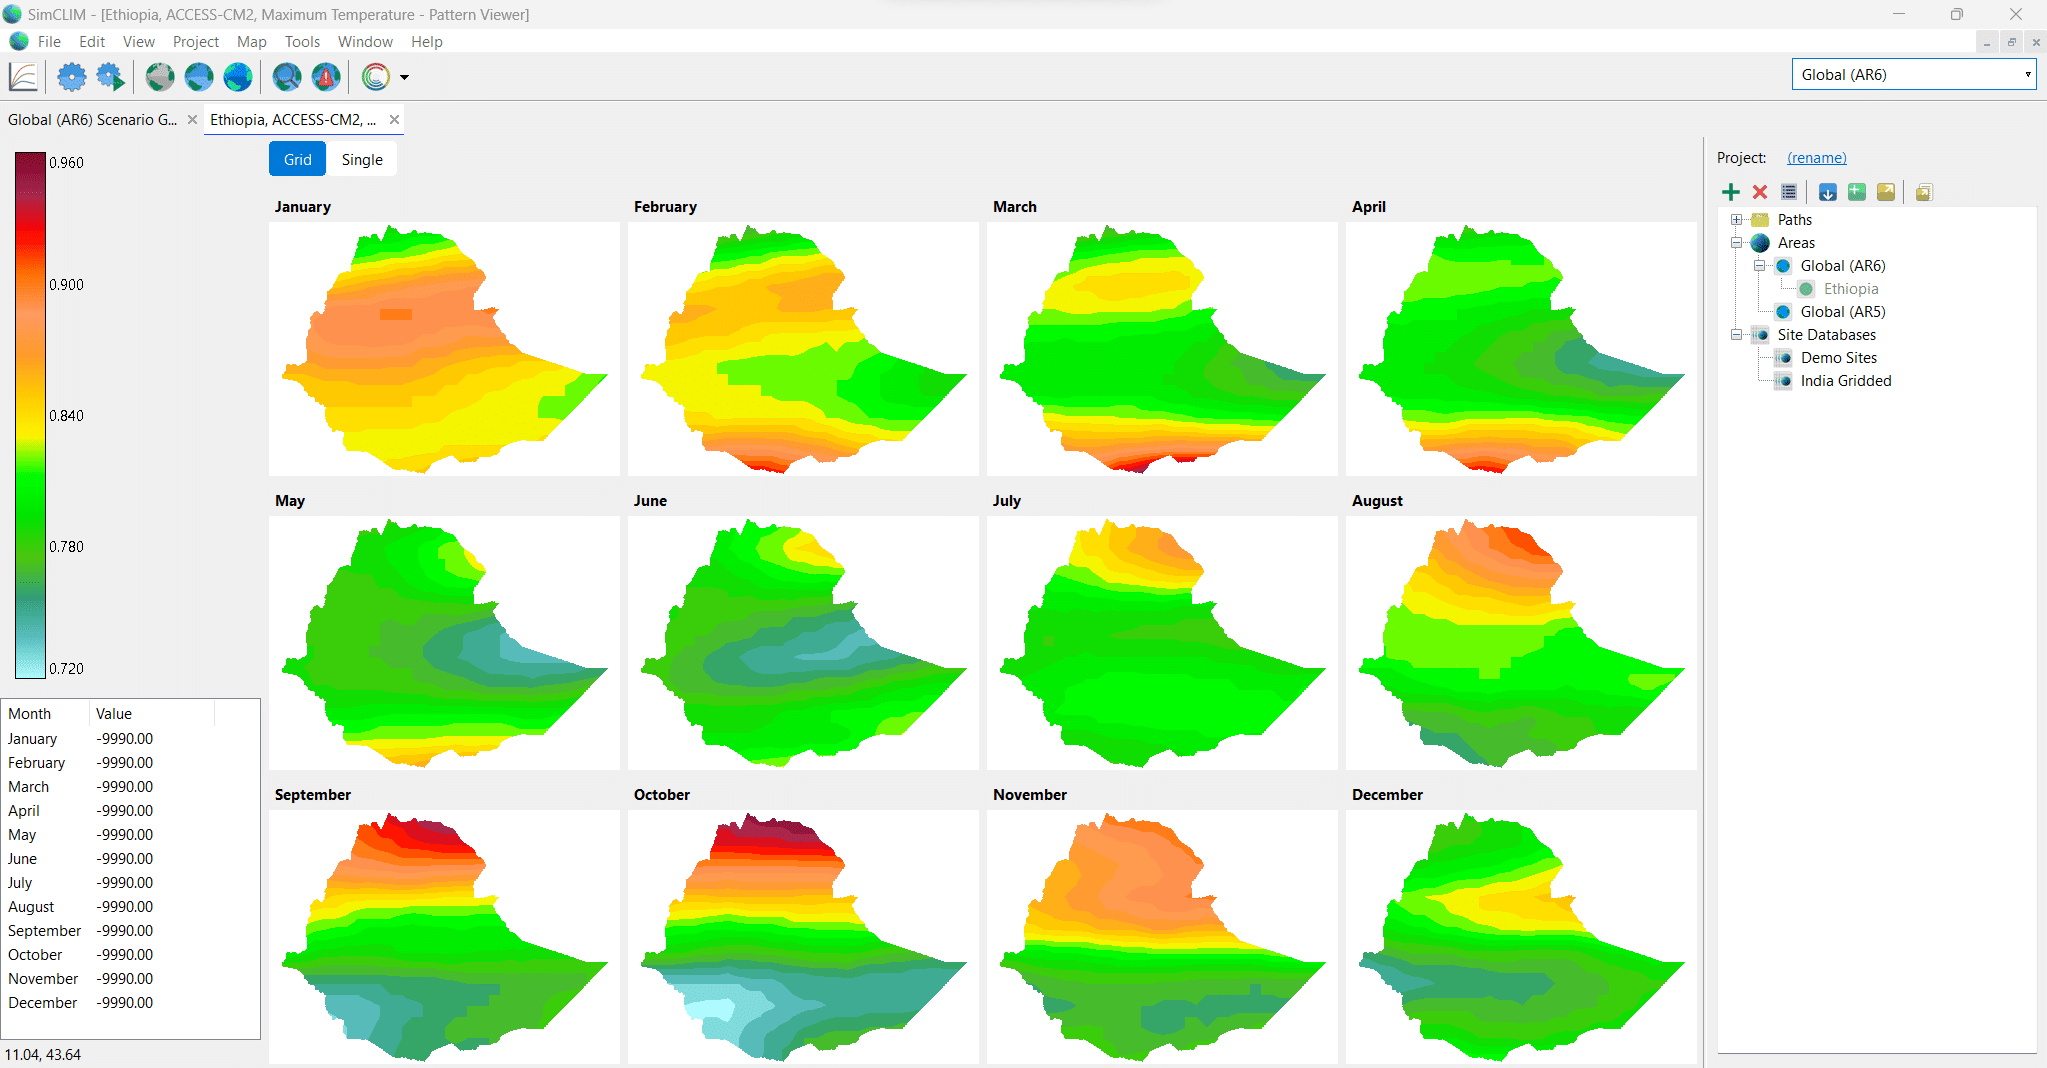
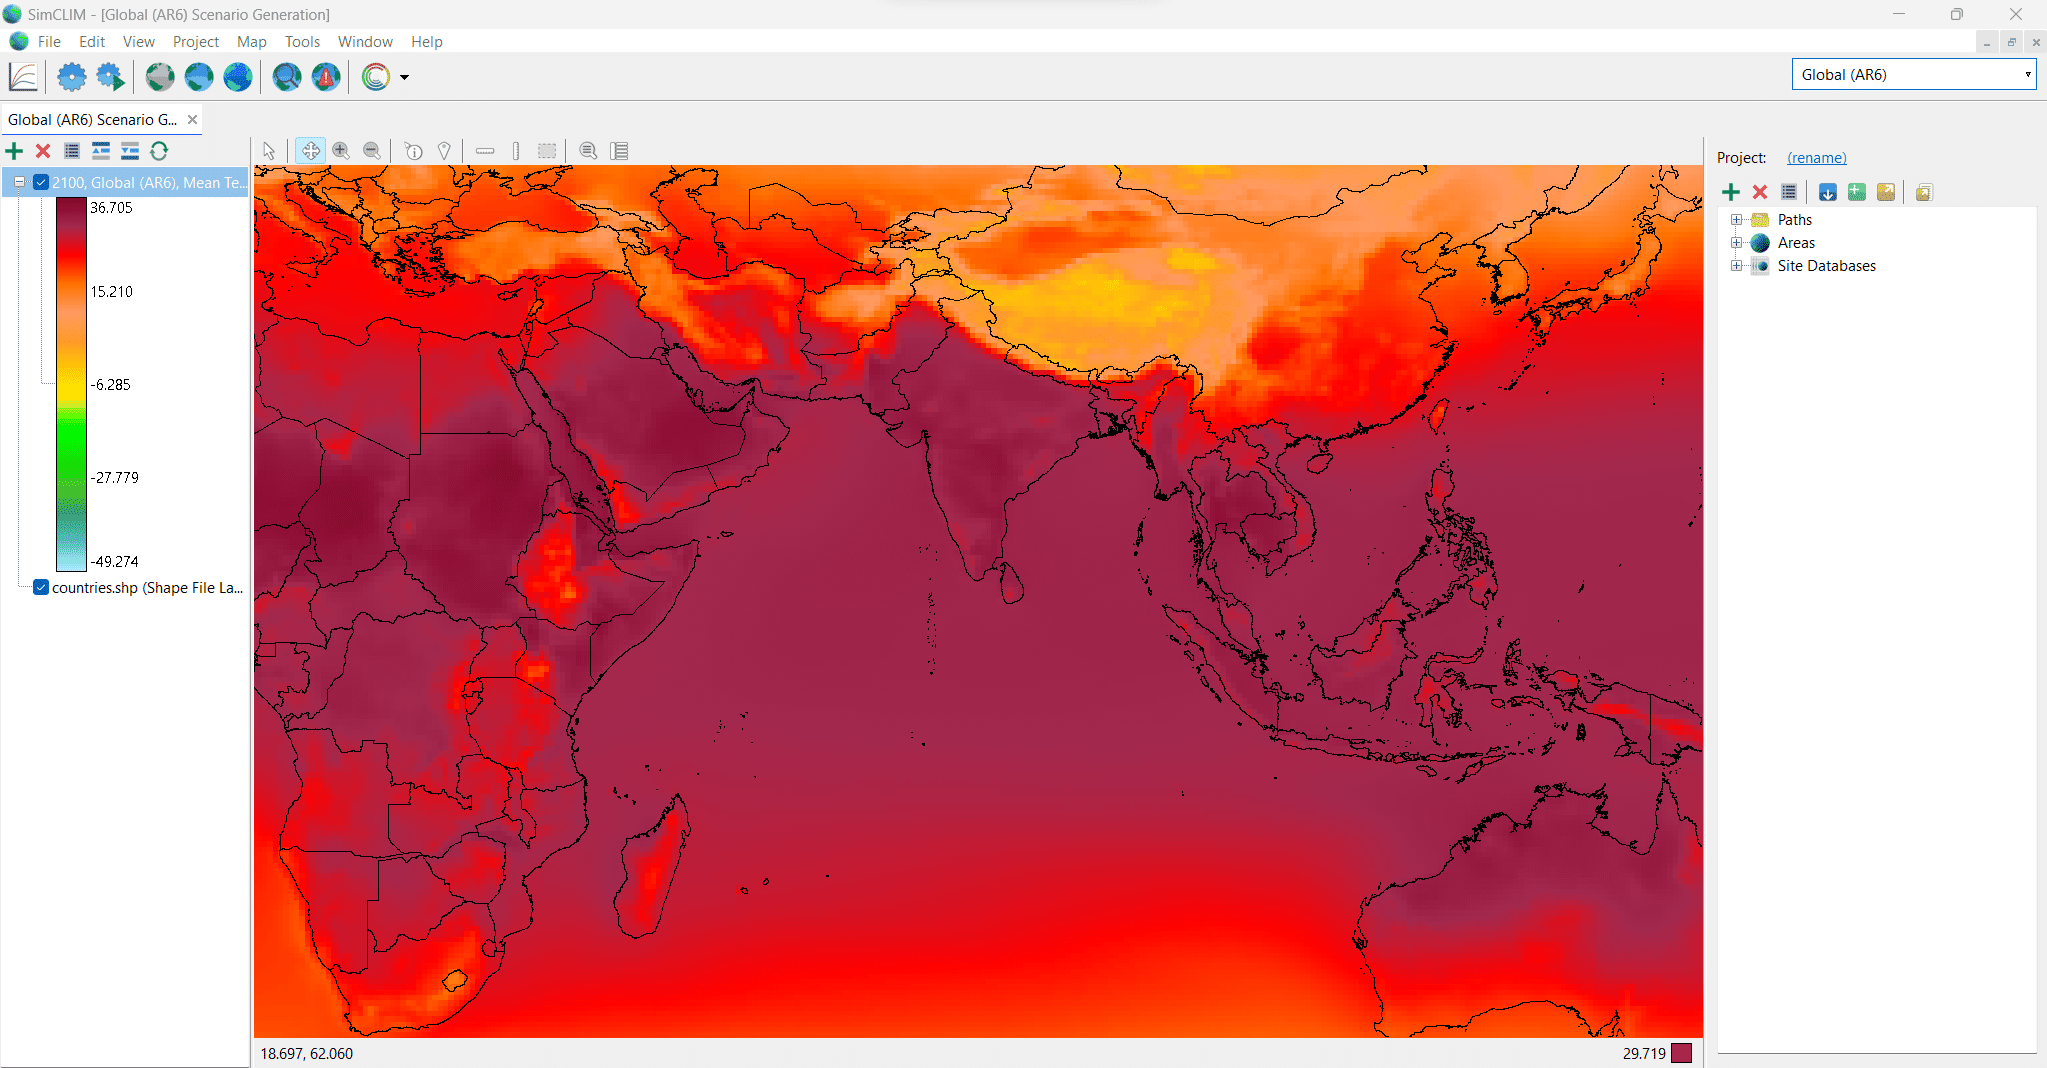
Explore maps with new mapping tools
Functionality includes an asset location input tool, and a map interface for adding asset sites.
Range of formats
Support for extended selection of data types and online datasets, including common formats such as .csv, .tsv and GIS shapefiles.
Import and Export
Outputs are viewable as tables and graphs within the web-based platform and are fully exportable as PDF, Word, CSV, or Excel. The platform also supports integration of output data with third-party software tools that require climatic inputs, for example hydrologic, agricultural or engineering models.
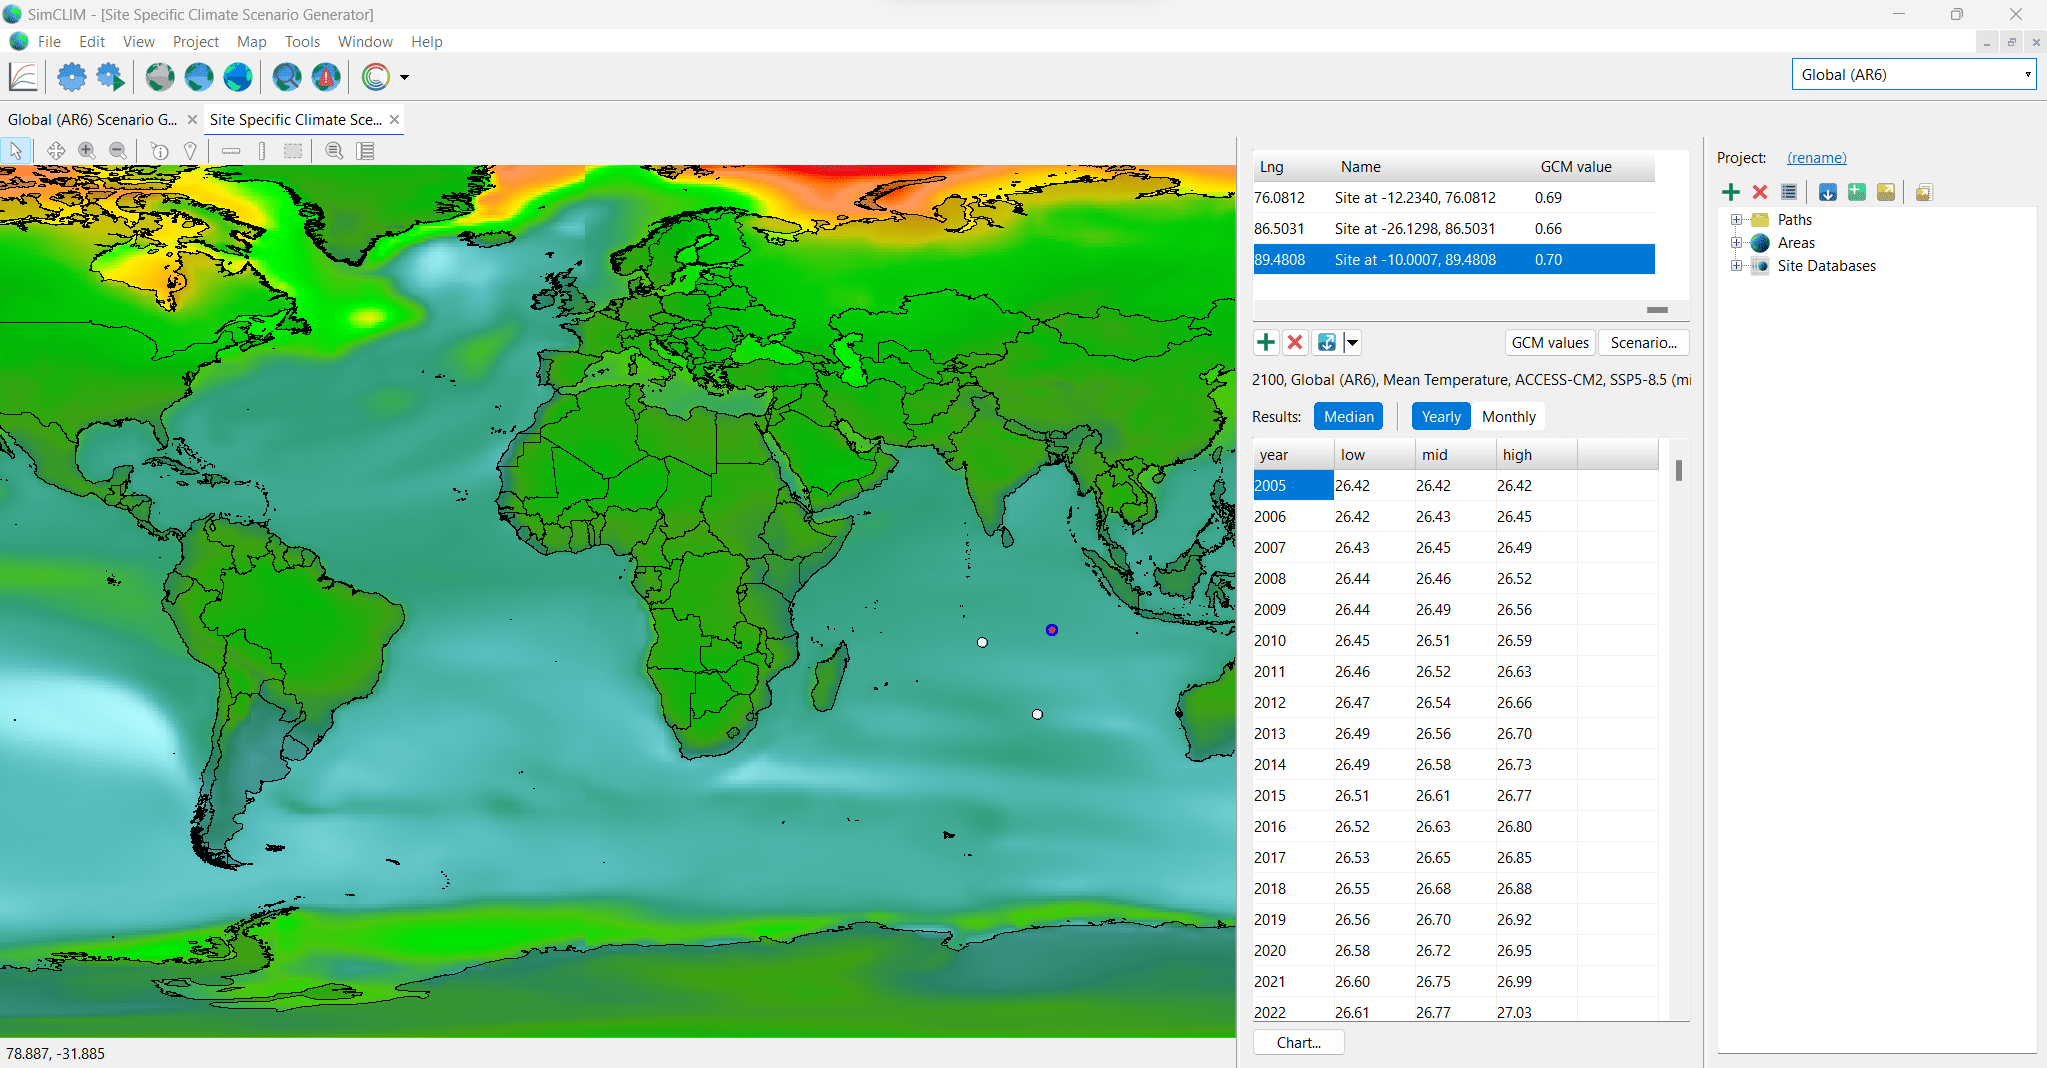
Spatial and site specific scenarios
Explore emission, climate sensitivity and sea level rise with or without land movement or extreme event analytics with or without climate change. Impact models include rainwater tank assessment, water balance, coastal erosion and degree days.
Customised, high-resolution study areas
Additional high-resolution data is available for specific needs such as bioregions, watersheds, trans-boundary study areas, eco-zones.
Sea Level Rise (SLR)
Explore sea level rise at coastal regions across the globe. Run different scenarios and timescales. Conduct site specific sea level analysis for adaptation and mitigation planning at an asset level.
Pricing
Included in all licence types: one downscaled country dataset, video tutorials, user manuals and help information, and technical email support.

University Licences
$POA
- USD
- Includes ready-to-use tutorials
- Options for personal and lab computers
Options for any size course or department.
Consultancy, Businesses
$6,997 per year
- USD
- per user
- annual subscription
- Additional countries and custom regions available
Government, NGO, Research Institution
$1,997 per year
- USD
- per user
- annual subscription
- Additional countries and custom regions available
Proof of incorporation as a not-for-profit organisation required.
Student Researcher
$199 per year
$30 per month
- USD
- per user
- Masters and PhD plans as low as $11 per month
- Additional countries and custom regions available
Proof of current enrolment required.
SimClim AR6 Demo
Preview
How it works
STEP 1.
Technical requirements
You will need an internet connection and a dual core central processing unit; Windows 7, 8, 10 or 11 (64-bit only); 8 GB RAM; and 12 GB of free disk space. It’s recommended that the SimCLIM and spatial data sets be stored on fast SSD drive
STEP 2.
Subscribe
Subscription is simple through my.climsystems.com. Click here to create an account and log into the ClimStore. Configure a SimClim licence that suits your needs to receive a quotation. When you are ready, accept the quotation and go to the Checkout to get your licence and data order underway.
STEP 3.
Install
Download and install SimClim software to get started.
Resources
User Docs
Learn more about SimClim AR6, including system requirements, detailed descriptions and guides for key functions and the Project Manager.
Data Docs
Learn more about the details of the data sources and corresponding standardisation methods for spatial and site data.
Frequently asked questions
Find answers to questions specific to SimClim AR6.
In what research has SimClim been used successfully?
SimClim has been used in support of over 160 peer reviewed research papers. Contact us for our comprehensive list.
Can I get training to use SimClim AR6?
We have created training videos to help you learn about the main functions of SimClim including the global database, spatial scenario generator and map viewer tools.
When was SimClim first developed?
With development started in 2002, SimClim was the next generation model of our CLIMPACTS programme which began in 1993 with funding from the New Zealand Government. CLIMPACTS was led by the International Global Change Institute at the University of Waikato and involved collaboration with other research organisations based in New Zealand. Envisaged as a tool for bridging science, policy and planning, the focus was on the development of a model system to examine, in a spatial and temporal context, the sensitivity of the managed environment to climate change and variability. SimClim builds on the functionality of CLIMPACTS and has evolved into being an active support tool for evaluating options for adapting to climate variability and change.
What do I need to prove my student status for SimClim AR6?
We ask you to provide proof of enrolment for the year the SimClim license starts and at the education level (under-grad, masters, PhD, post-grad) indicated.
How can I use SimClim AR6 to teach students?
SimClim can be used to demonstrate different climate models within CMIP6 ESMs and CMIP5 (optional), do analysis of the model for gridded and point data, and explore future pathways. It is a great tool to teach about the complexities, use cases and limitations of global climate models.
What type of subscriptions are available?
Annual individual subscriptions and institutional subscriptions are available. Special term subscriptions are also available for short courses.
How do I get access for my entire class?
The lab licence is available in 5 and 15 seat options. You can bundle these together to provide access for your class.
What if I need data that is not part of the software? How can I request it?
You can get in touch with our climate science team to request data to be added to SimClim.
What is the difference between SimClim AR6 and Climate Insights?
SimClim is a stand-alone modelling system designed to facilitate the assessment of risks from climate change, integrating the latest scientific projections of future climate changes for teaching, research and education purposes. The desktop (windows OS) application gives access to spatially gridded data of seven key climate metrics at monthly temporal resolution, including mean, max and min temperatures, precipitation, wind speed, solar radiation and relative humidity in data packs on a country basis. The desktop app also provides a number of analysis tools, including scenario generation, timeseries data exploration, extreme event analysis, rain water tank modelling, water balances, coastal erosion, and degree days. Climate Insights is our flagship climate risk assessment tool driven off our Climate Insights Database and enables you to understand the site-specific projected impacts of acute and slow-onset climate change for your assets or operations.
Climate Insights can be accessed through either a self-serve or valet subscription. With the self-serve option, you get access through a web app to point location data for 60+ variables at monthly or higher temporal resolution. The data can be downloaded for multiple sites or accessed through an API. A valet subscription offers access to a physical climate change risk report and digital files of the associated data.
Will the country data package allow me to calculate the sea level rise for the coasts? If yes, for how many years?
In SimClim, Sea Level Rise (SLR) is a global dataset, which is provided in the India AR6 package. The SLR data focuses on future projections, with all baseline (centred in 2005) values set to zeros. That is to say, the SLR values are relative to current climatic conditions. They are also site-specific, meaning that you need to do analysis individually along any part of the Indian coastline.
What data or parameter values are built into SimClim?
SimClim AR 6 gives you access to spatially gridded data of eight key climate metrics at a monthly temporal resolution, including: SLR, mean, max and min temperatures, precipitation, wind speed, solar radiation and relative humidity.